Note
Go to the end to download the full example code.
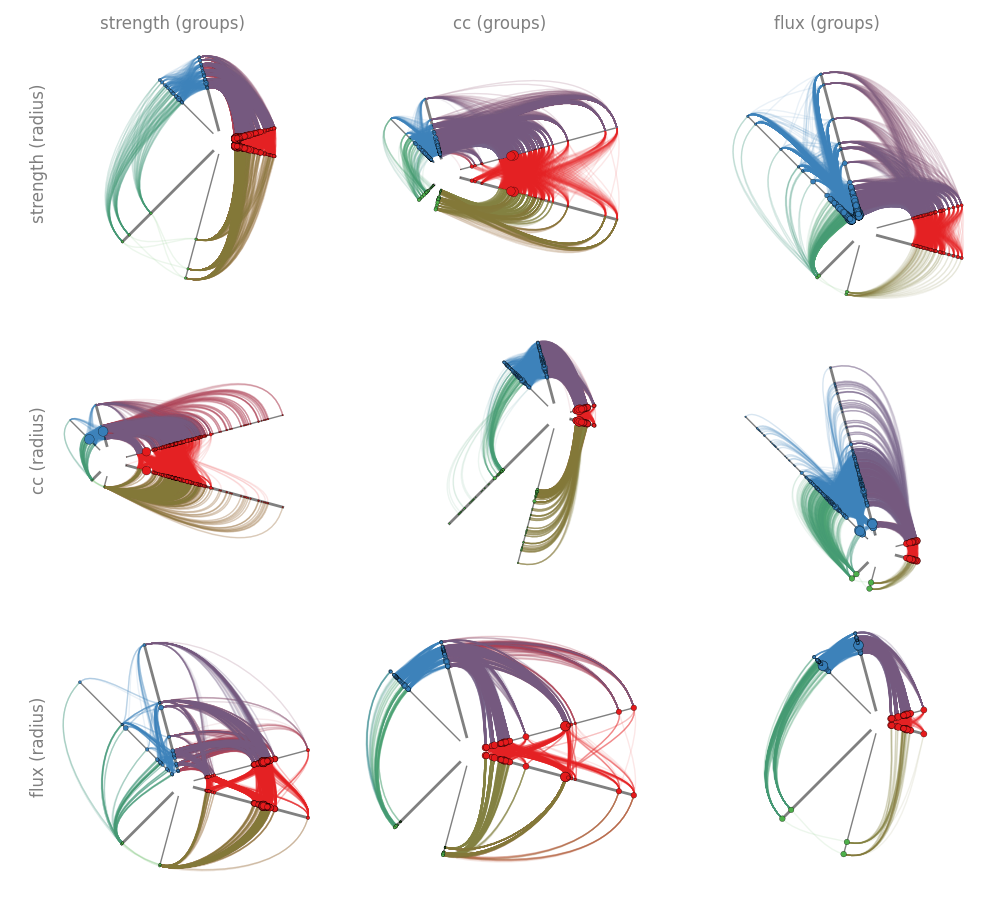
Hive plot panel#
import inspect
from os.path import abspath, dirname

import matplotlib.pyplot as plt

import nngt


plt.rcParams.update({
    "figure.facecolor": (0, 0, 0, 0), "text.color": "grey"
})


dirpath  = dirname(inspect.getframeinfo(inspect.currentframe()).filename)
rootpath = abspath(dirpath + "/../../..")


# load graph

g = nngt.load_from_file(rootpath + "/testing/Networks/rat_brain.graphml",
                        attributes=["weight"], cleanup=True,
                        attributes_types={"weight": float})


# prepare attributes

cc = nngt.analysis.local_clustering(g, weights="weight")

g.new_node_attribute("cc", "double", values=cc)

g.new_node_attribute("strength", "double",
                     values=g.get_degrees(weights="weight"))

flux = g.get_degrees("out") - g.get_degrees("in")

g.new_node_attribute("flux", "double", values=flux)


# figure parameters

cc_bins = [0, 0.1, 0.25, 0.6]

todo = ["strength", "cc", "flux"]
bins = [3, cc_bins, 3]


# make plot

fig, axes = plt.subplots(len(todo), len(todo), figsize=(10, 9))

for i in range(len(todo)):
    radial = todo[i]

    for j in range(len(todo)):
        ax_name = todo[j]
        ax_bins = bins[j]

        ax = axes[i, j]

        if i == 0:
            ax.set_title(ax_name + " (groups)")

        size = todo[list(set([0, 1, 2]).difference([i, j]))[0]]

        nngt.plot.hive_plot(
            g, radial, axes=ax_name, edge_alpha=0.1, nsize=size, max_nsize=50,
            axes_bins=ax_bins, axes_units="native", axis=ax, show_names=False)

for i in range(len(todo)):
    fig.text(0.03, 0.83 - i*0.33, todo[i] + " (radius)", rotation=90,
             fontsize="large", va="center")

plt.tight_layout()

plt.show()
Total running time of the script: (0 minutes 12.564 seconds)