Note
Click here to download the full example code
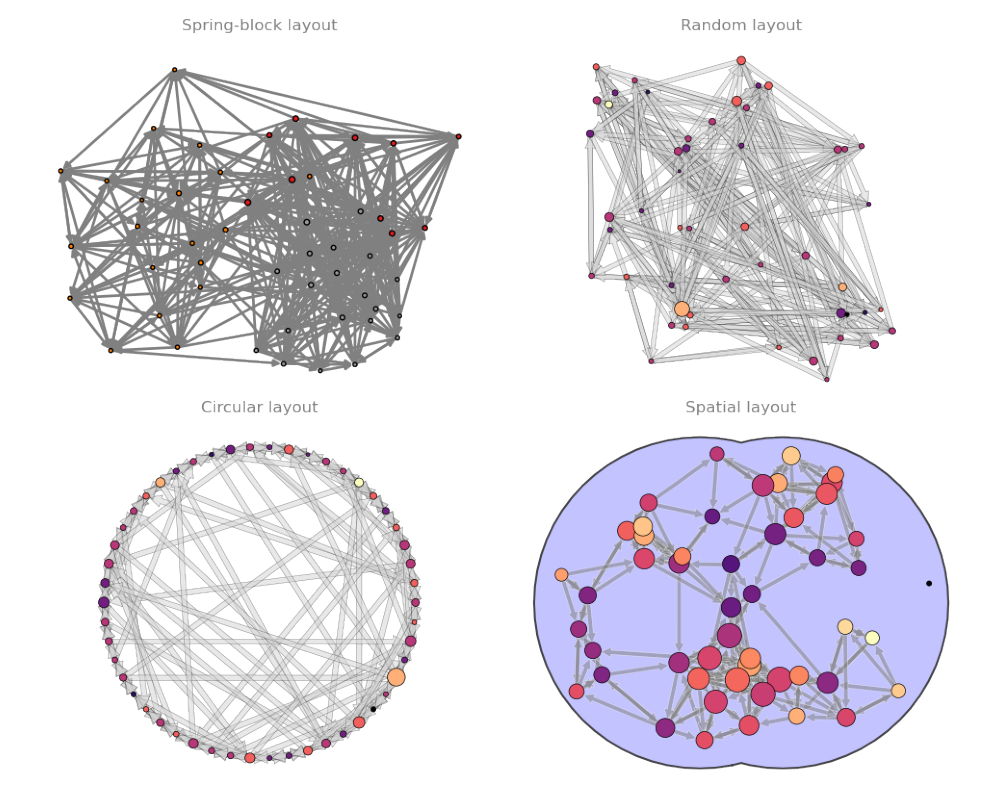
Layouts for topological representations#
import os

import matplotlib as mpl
import matplotlib.pyplot as plt

import nngt


plt.rcParams.update({
    "figure.facecolor": (0, 0, 0, 0),
    "axes.labelcolor": "grey", "text.color": "grey"
})


nngt.seed(0)


# set matplotlib backend depending on the library
mpl_backend = mpl.get_backend()

if nngt.get_config("backend") in ("graph-tool", "igraph"):
    if mpl_backend.startswith("Qt4"):
        if mpl_backend != "Qt4Cairo":
            plt.switch_backend("Qt4Cairo")
    elif mpl_backend.startswith("Qt5"):
        if mpl_backend != "Qt5Cairo":
            plt.switch_backend("Qt5Cairo")
    elif mpl_backend.startswith("GTK"):
        if mpl_backend != "GTK3Cairo":
            plt.switch_backend("GTK3Cairo")
    else:
        plt.switch_backend("cairo")


# prepare figure and parameters

fig = plt.figure(figsize=(10, 8), constrained_layout=False)

gs = fig.add_gridspec(nrows=2, ncols=2, left=0, right=1, bottom=0, top=0.97,
                      wspace=0, hspace=0.05)

axes = [fig.add_subplot(gs[i, j]) for i in (0, 1) for j in (0, 1)]

num_nodes = 50


# spring-block layout for structured graph

room1 = nngt.Group(10)
room2 = nngt.Group(20)
room3 = nngt.Group(20)

names = ["R1", "R2", "R3"]

struct = nngt.Structure.from_groups((room1, room2, room3), names)

g = nngt.Graph(structure=struct)

for room in struct:
    nngt.generation.connect_groups(g, room, room, "erdos_renyi", avg_deg=5)

nngt.generation.connect_groups(g, (room1, room2), struct, "erdos_renyi",
                               avg_deg=3, ignore_invalid=True)

nngt.generation.connect_groups(g, room3, room1, "erdos_renyi", avg_deg=5)

nngt.plot.library_draw(g, tight=False, axis=axes[0], ecolor="grey",
                       show=False)

axes[0].set_title("Spring-block layout")


# random layout

sw = nngt.generation.watts_strogatz(4, 0.3, nodes=num_nodes)

betw = nngt.analysis.betweenness(sw, "node")

nngt.plot.draw_network(sw, nsize=betw, ncolor="out-degree", axis=axes[1],
                       ecolor="lightgrey", tight=False, show=False)

axes[1].set_title("Random layout")


# circular layout for small-world networks

nngt.plot.draw_network(sw, nsize=betw, ncolor="out-degree", layout="circular",
                       ecolor="lightgrey", axis=axes[2],
                       show=False, tight=False)

axes[2].set_title("Circular layout")


# spatial layout

c1 = nngt.geometry.Shape.disk(100)
c2 = nngt.geometry.Shape.disk(100, centroid=(50, 0))

shape = nngt.geometry.Shape.from_polygon(c1.union(c2))

max_nsize = 15
npos  = shape.seed_neurons(num_nodes, soma_radius=0.5*max_nsize)

g = nngt.generation.distance_rule(10, shape=shape, nodes=num_nodes, avg_deg=5,
                                  positions=npos)

cc = nngt.analysis.local_clustering(g)

nngt.plot.draw_network(g, ncolor=cc, axis=axes[3], ecolor="grey", show=False,
                       eborder_width=0.5, eborder_color="w", esize=10,
                       max_nsize=max_nsize, tight=False)

axes[3].set_title("Spatial layout")

# save figure

fname = os.getcwd() + "/layouts.png"

plt.savefig(fname)
plt.switch_backend(mpl_backend)

img = plt.imread(fname)

_, ax = plt.subplots(figsize=(10, 8))
ax.imshow(img)

ax.axis('off')

plt.tight_layout()
plt.show()

try:
    os.remove(fname)
except:
    pass
Out:
/home/docs/checkouts/readthedocs.org/user_builds/nngt/conda/v2.5.1/lib/python3.8/site-packages/nngt-2.5.1-py3.8-linux-x86_64.egg/nngt/geometry/plot.py:201: UserWarning: linestyle is redundantly defined by the 'linestyle' keyword argument and the fmt string "" (-> linestyle='-'). The keyword argument will take precedence.
  ax.plot(x, y, m, ls='-', c=ec, markerfacecolor=mc, zorder=1)
Note that the last lines are just a little trick to make the figure be
automatically detected by Sphinx-gallery. For normal use cases you can just
do a regular plt.show().
Total running time of the script: ( 0 minutes 3.308 seconds)