Gallery#
This page contains a set of examples about different ways of visualizing graphs and their properties using NNGT.
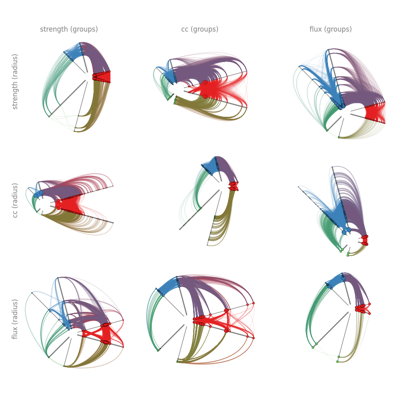
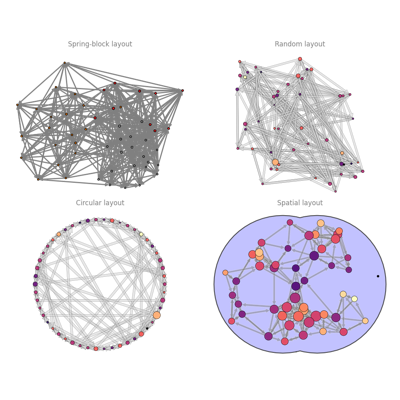
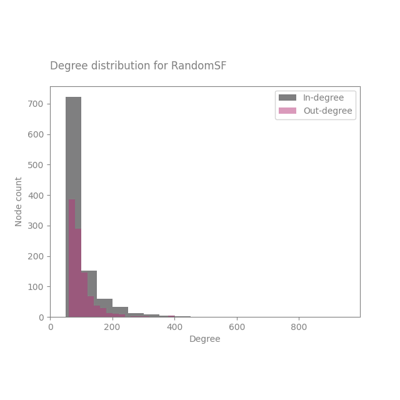
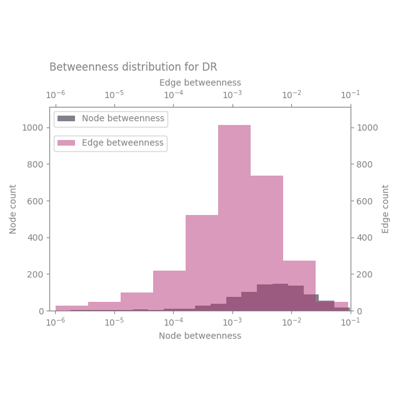
Visualizing graph structures#
The following examples show how to use NNGT to draw graphs in ways that make their structural properties stand out.
Geospatial networks
Chord diagram
Hive plot panel
Layouts for topological representations
Visualizing graph properties#
Plot the degree distributions of a graph
Plot the betweenness distributions of a graph
Plot various graph properties