Note
Go to the end to download the full example code
Chord diagram#
import matplotlib.pyplot as plt

import nngt

plt.rcParams["figure.facecolor"] = (0, 0, 0, 0)

nngt.seed(0)


# create a structured graph

room1 = nngt.Group(25)
room2 = nngt.Group(50)
room3 = nngt.Group(40)
room4 = nngt.Group(35)

names = ["R1", "R2", "R3", "R4"]

struct = nngt.Structure.from_groups((room1, room2, room3, room4), names)

g = nngt.Graph(structure=struct, directed=True)

for room in struct:
    nngt.generation.connect_groups(g, room, room, "all_to_all")

nngt.generation.connect_groups(g, (room1, room2), struct, "erdos_renyi",
                               avg_deg=10, ignore_invalid=True)

nngt.generation.connect_groups(g, room3, room1, "erdos_renyi", avg_deg=20)

nngt.generation.connect_groups(g, room4, room3, "erdos_renyi", avg_deg=10)


# get the structure graph and plot

sg = g.get_structure_graph()

# undirected version of the chord diagram
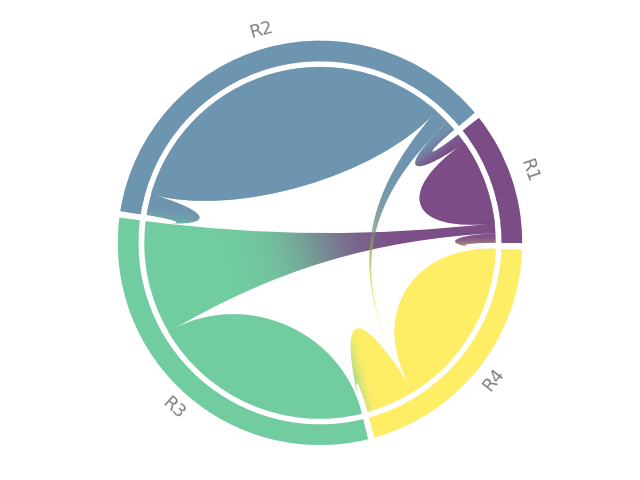
nngt.plot.chord_diagram(sg, names="name", sort="distance", fontcolor="grey",
                        use_gradient=True, directed=False, show=False)

# directed chord diagram
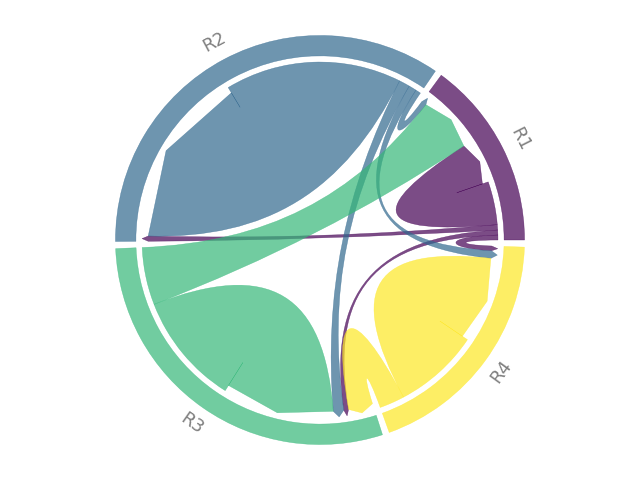
nngt.plot.chord_diagram(sg, names="name", sort="distance", fontcolor="grey",
                        use_gradient=True, directed=True, show=True)
Total running time of the script: (0 minutes 1.168 seconds)

