Contents Menu Expand Light mode Dark mode Auto light/dark mode
NNGT 2.7.0-dev
Logo
NNGT 2.7.0-dev

User Documentation

  • Installation
  • Intro & user manual
    • Graph generation
    • Properties of graph components
    • Consistent tools for graph analysis
    • Parallelism
    • Groups, structures, and neuronal populations
    • Interacting with the NEST simulator
    • Activity analysis
      • Simulation module
    • Graph generation
    • Main module (API)
      • Graph classes
      • Main functions
      • Side classes
      • Analysis module
      • Generation module
      • Geometry module
      • Lib module
      • Plot module
      • Simulation module
  • Tutorial
  • Gallery
    • Visualizing graph structures
      • Geospatial networks
      • Chord diagram
      • Hive plot panel
      • Layouts for topological representations
    • Visualizing graph properties
      • Plot the degree distributions of a graph
      • Plot the betweenness distributions of a graph
      • Plot various graph properties
    • Geospatial networks
    • Chord diagram
    • Hive plot panel
    • Layouts for topological representations
    • Plot the degree distributions of a graph
    • Plot the betweenness distributions of a graph
    • Plot various graph properties

Contributing

  • Contributing to NNGT
  • SourceHut
  • Codeberg
  • GitHub

Modules

  • Main module (API)
    • Graph classes
    • Main functions
    • Side classes
    • Analysis module
    • Generation module
    • Geometry module
    • Lib module
    • Plot module
    • Simulation module
  • Analysis module
  • Database module
  • Generation module
  • Geospatial module
  • Geometry module
  • Lib module
  • Plot module
  • Simulation module
Back to top

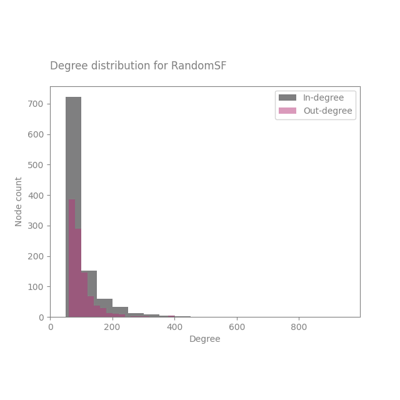
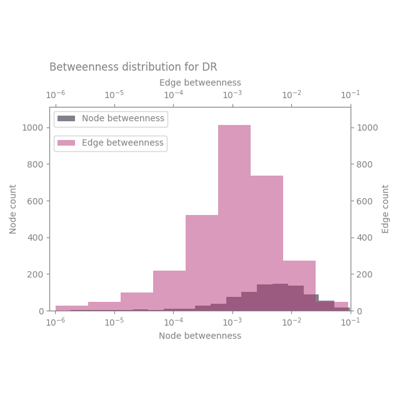
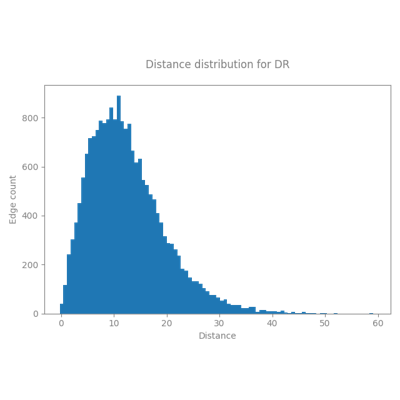
Visualizing graph properties#

Plot the degree distributions of a graph

Plot the degree distributions of a graph

Plot the betweenness distributions of a graph

Plot the betweenness distributions of a graph

Plot various graph properties

Plot various graph properties

Download all examples in Python source code: graph_properties_python.zip

Download all examples in Jupyter notebooks: graph_properties_jupyter.zip

Gallery generated by Sphinx-Gallery

Next
Plot the degree distributions of a graph
Previous
Layouts for topological representations
Copyright © 2015, Tanguy Fardet
Made with Sphinx and @pradyunsg's Furo