Note
Go to the end to download the full example code.
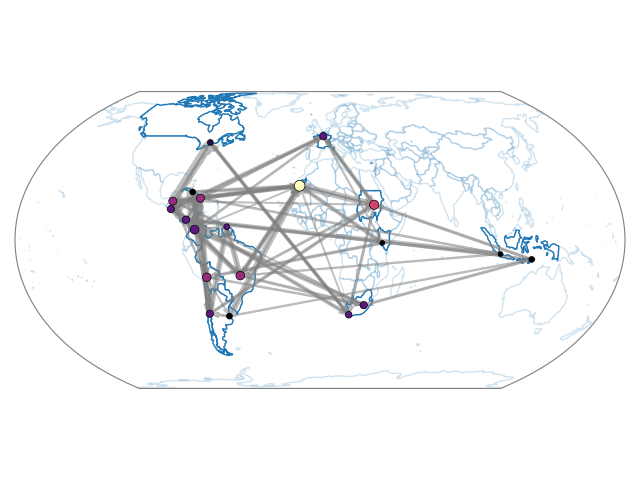
Geospatial networks#
import os

import cartopy.crs as ccrs
import matplotlib.pyplot as plt
import numpy as np

import nngt
import nngt.geospatial as ng


plt.rcParams.update({
    'axes.edgecolor': 'grey', 'xtick.color': 'grey', 'ytick.color': 'grey',
    "figure.facecolor": (0, 0, 0, 0), "axes.facecolor": (0, 0, 0, 0),
    "axes.labelcolor": "grey", "text.color": "grey"
})


nngt.seed(2)


# take random countries
num_nodes = 20

world = ng.maps["adaptive"]
units = nngt._rng.choice(50, num_nodes, replace=False)
codes = list(world.iloc[units].SU_A3)

# make random network
g = nngt.generation.erdos_renyi(nodes=num_nodes, avg_deg=3)

# add the A3 code for each country (that's the crucial part that will link
# the graph to the geospatial data)
g.new_node_attribute("code", "string", codes)

g.set_weights(nngt._rng.exponential(2, g.edge_nb()))

# plot using draw_map and the A3 codes stored in "code"
ng.draw_map(g, "code", ncolor="in-degree", esize="weight", threshold=0,
            ecolor="grey", proj=ccrs.EqualEarth(), max_nsize=20, show=False)

if nngt.get_config("with_plot"):
    plt.tight_layout()
    plt.show()
Total running time of the script: (0 minutes 0.181 seconds)